
Population Explosion
That's a lot of people. So many that, like us, you might be having a little difficulty really understanding a number that large. Let's try to put it in perspective. Say you're 12 years old and you want to count to the number one billion. If you're able to count one number per second continuously without sleeping, you would be almost 44 years old by the time you reached one billion. Or think about it this way: One billion seconds is 31.7 years. Two billion seconds is 63.4 years. Five billion seconds is 158.5 years.
We've established that there are a lot of people on our planet. But, you may be wondering, "Why keep track of the population? Why do we care how many people there are on Earth? What's the big deal, anyway?" It actually is a really big deal. You see, the population is definitely a lot more than a huge number.
National Scope In a country as large as the United States, how is it possible to count each person residing within its borders? Since 1790, national census information has been taken every 10 years (in years ending in zero) because it is mandated by the U.S. Constitution under Article 1 Section 2. The information that the census tracks is very important. Over $100 billion in federal funds is given out each year for community programs and services, such as education programs, housing and community development, health-care services for the elderly, job training and more. Population information helps the government decide how to divide that money around the country. The U.S. Congress uses the census totals to determine how many seats your state will have in the U.S. House of Representatives. And, states use the numbers to allocate seats in their law-making bodies. State and local governments use census information in other ways, too. Census totals help state and local officials plan and allocate funds for new school construction, libraries and other public buildings, highway safety and public transportation systems, new roads and bridges, location of police and fire departments and many other projects. Census information helps health providers predict the spread of diseases. And when floods, tornadoes or earthquakes hit, the census tells rescuers how many people will need their help. Even businesses use census information. It's how they decide where to locate restaurants, shopping centers, movie theaters, theme parks, banks and more. As you can see, all that we learn about ourselves by studying the population helps a lot. The U.S. population is more than just the number of people residing within this country. These numbers affect the very quality of our life. Not only are population studies significant here, they are vital worldwide. Global Scope There are people all around the world who devote their time to studying the population. The numbers tell us many things. For example, right now:
While you're reading this article, you are probably someplace where you can easily get some water. Because you can simply stroll down your school's hall for a cold refreshing drink, you might think that resources aren't limited. But they are. People are living without running water. Others are living without access to safe drinking water. And not all of these people are living in less developed countries. Some of them are living right here in the United States. Imagine walking several miles to collect water for your family, only to become ill from it. Water supplies are often contaminated. In fact, millions die each year because of contaminated water. When you start looking at the population and the environment, it's easy to see how they are remarkably linked. You also begin to see links to other things like poverty, education, health and more. People from countries all around the world understand how important these connections are. For example, 191 member states of the United Nations are committed to fulfilling the Millennium Development Goals by the year 2015. Many of these goals are very closely tied to population issues. For example, they're working to rid the world of extreme poverty and hunger, provide primary education to everyone, improve maternal and child health and ensure environmental sustainability. People living in developed countries like ours use resources much faster than we can replenish them. Think about deforestation, water shortages, and water and air pollution. Every time we build a new neighborhood or a new shopping center -- that has an impact. While it is providing needed shelter and access to foodstuffs and other materials, it's also taking its toll on the local environment. And this toll has a larger affect, worldwide. As we deplete our resources here in the United States, we look to other countries and their lands for more resources. |

The population explosion
This
year, there will be 7 billion people on Earth. But how will the planet
will cope with the expanding population – and is there anything we can,
or should, do to stop it?

.
Essential Concepts
There are 5 main concepts that our students struggle with when learning about population growth and the relationship of population to geological resource use: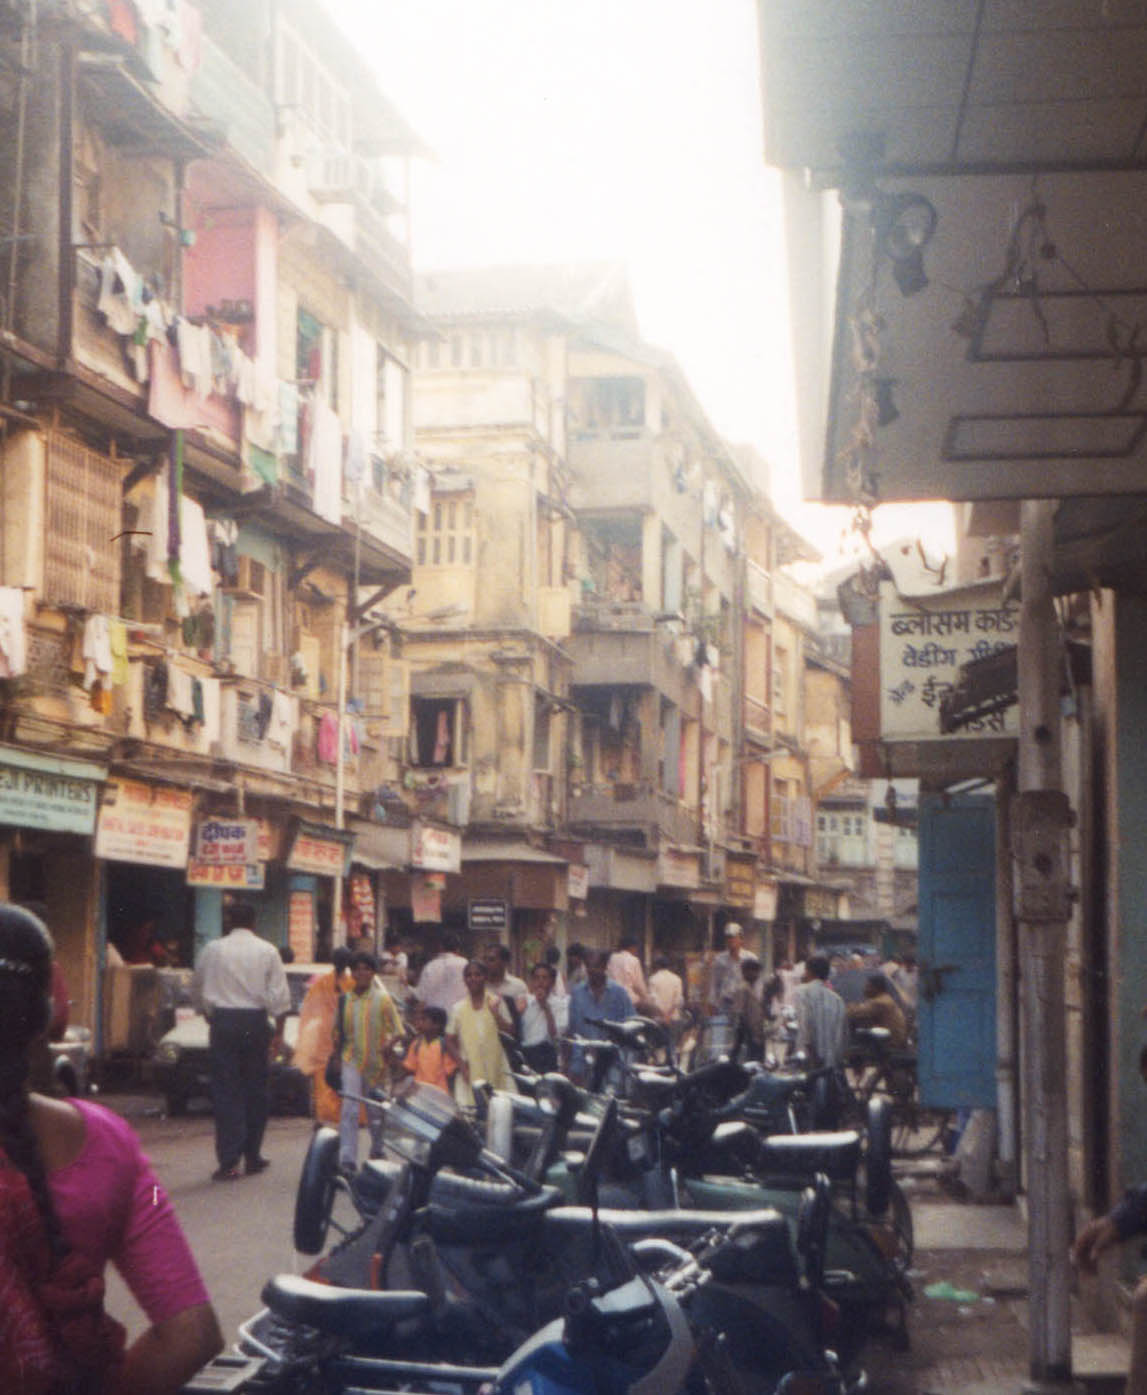
- overpopulation is a leading environmental problem,
- exponential population growth and development leads to faster depletion of resources,
- population grows exponentially,
- why population prediction is difficult,
- population is not evenly distributed throughout the world.
A leading environmental problem: Overpopulation
Students do not understand that overpopulation is the cause of many other environmental problems. To help students understand this, one of my colleagues asks her students to list three important local and global environmental issues as part of a survey on the first day of class. During the following lecture, she presents overpopulation as the top environmental problem:
It may surprise many of you to find out
that overpopulation is a leading global environmental problem. Remember
on the first day of class, I asked you to list three important global
environmental problems. Here are the results of those surveys:
How many of these problems are the direct or indirect result of overpopulation? Would we have such a problem with the top three -- pollution, global warming and habitat -- if world population was not so large? Other than some of the natural disasters (and even those are arguable), most of these other environmental problems are due to overpopulation.
How many of these problems are the direct or indirect result of overpopulation? Would we have such a problem with the top three -- pollution, global warming and habitat -- if world population was not so large? Other than some of the natural disasters (and even those are arguable), most of these other environmental problems are due to overpopulation.
Lifestyle affects resource use
The characterization of overpopulation as the cause of many environmental problems may be an oversimplification. Consumption of natural resources also plays an important role in straining the environment. On a global scale, it is probably pretty intuitive to students that the presence of more people in the world causes a bigger strain on natural resources. What may not be intuitive is the concept of sustainability. What does sustainability mean?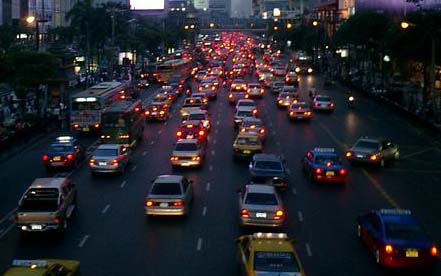

The above makes developed nations out to be the bad guys but that is not entirely true. Undeveloped countries with large (and growing) populations also put a strain on the local environment and the limited resources that they have. Countries that struggle to meet growing demands for food, fresh water, timber, fiber and fuel can alter the fragile ecosystems in their area, putting a great strain on the limited resources that they have to draw from (ICTSD.org).
More people = More babies
Students may have a hard time understanding that population growth is controlled not only by birth and death rates but also by the present population. The mathematics of exponential growth govern the prediction of population growth. In some cases, you may want to point out that students may have heard of exponential growth in other contexts, such as compound interest or the spread of viral disease. The rate of population growth at any given time can be written:
- r is the rate of natural increase and is usually expressed as a percentage (birth rate - death rate)
- t a stated interval of time, and
- N is the number of individuals in the population at a given instant.
- but most students in entry-level courses can handle the algebraic solution presented below.
The algebraic solution to this differential equation is
- N0 is the starting population
- N is the population after
- a certain time, t , has elapsed,
- r is the rate of natural increase expressed as a percentage (birth rate - death rate) and
- e is the constant 2.71828... (the base of natural logarithms).
Essential to understanding the mathematics of population growth is the concept of doubling time. Doubling time is the time it takes for population to double and it is related to the rate of growth. When the population doubles, N = 2N0. Thus the equation becomes
- ln 2/r = t
or
0.69/r = t; where r is the rate and t is the doubling time.
In many ways, it is similar to half-life. But instead of the time it takes for half the isotopes to decay, it is the time it takes for a known quantity to double.
Population prediction models: Subject to change
Students (especially those in introductory classes) may have a difficult time understanding why predictions of population growth are difficult to make and constantly debated. To help them understand the difficulty of prediction have them think about the complex variables that must be considered when predicting population growth. It may be fairly obvious to students that calculation of the rate of population growth can be expressed in the following equation:
Birth rate (b)- death rate (d) = rate of natural increase (r)
Thus, population growth is directly related to: 
- current population - the number of people today has implications for future population
- birth rate - this number is usually reported in number of births per 1,000 people per year and combined with the death rate influences the growth of population
- death rate - this number is usually reported in number of deaths per 1,000 people per year and combined with birth rate influences the growth of population
Let's
think about some of the factors that may modify the birth and death
rates in a region (or in the world). Do you think these things are
constant throughout time? What other "variables" could change them?
There are many more variables that can affect change in the population and its growth - have your students brainstorm about other factors that affect the rate and prediction of population growth.
UNESCO and World Bank have a website with a number of learning modules on population related topics.
There are many more variables that can affect change in the population and its growth - have your students brainstorm about other factors that affect the rate and prediction of population growth.
UNESCO and World Bank have a website with a number of learning modules on population related topics.
Wide open spaces can be hard to find
The concept of population density is sometimes difficult for students to grasp. Population density can be calculated by dividing the total population of a city (or country) by its area.- Total population / area = population density
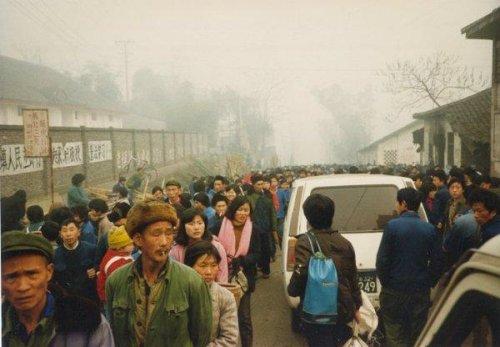
I also use a story about a friend of mine
who moved from China to the U.S. about 5 years ago. My friend Gong Yan
moved to Atlanta from Wuhan, China, where he grew up and went to
university. When he got to Atlanta, he was very uncomfortable because he
felt there was so much open space.
 In Wuhan, when he was in a public place, he was always
surrounded by people - people bumping into him, people talking to him,
people streaming along the street. He would often go to a mall in
Atlanta just to be around people. In contrast, many Americans become
uncomfortable when in large crowds. A friend of mine traveled to Japan
and tells a story of standing in line at the airport with the Japanese
gentleman behind her pushing her with her body while she strained not to
touch the person in front of her in line. Culturally,
we deal with population density problems by changing our concept of
"personal space". In many parts of the U.S., we have the luxury of
significant amounts of personal space; other developing and highly urban
places do not.
In Wuhan, when he was in a public place, he was always
surrounded by people - people bumping into him, people talking to him,
people streaming along the street. He would often go to a mall in
Atlanta just to be around people. In contrast, many Americans become
uncomfortable when in large crowds. A friend of mine traveled to Japan
and tells a story of standing in line at the airport with the Japanese
gentleman behind her pushing her with her body while she strained not to
touch the person in front of her in line. Culturally,
we deal with population density problems by changing our concept of
"personal space". In many parts of the U.S., we have the luxury of
significant amounts of personal space; other developing and highly urban
places do not.

Population growth
From Wikipedia, the free encyclopedia

In demography, population growth is used informally for the more specific term population growth rate (see below), and is often used to refer specifically to the growth of the human population of the world.
Simple models of population growth include the Malthusian Growth Model and the logistic model.
Population growth 1800-2011: from 1 billion to 7 billion estimated in 31.10.2011. During the year 2011, according to estimates:[1]
| Population[1] | |||
|---|---|---|---|
| Year | Billion | ||
| 1800 | 1 | ||
| 1927 | 2 | ||
| 1960 | 3 | ||
| 1974 | 4 | ||
| 1987 | 5 | ||
| 1999 | 6 | ||
| 2011* | 7 | ||
| UNFPA United Nations Population Fund estimate 31.10.2011 |
= | ||
- 135 million people will be born
- 57 million people will die and
- 78 million people will increase the world population.
Contents |
Determinants of population growth
Population growth is determined by four factors, births(B), deaths(D), immigrants(I), and emigrants(E). Using a formula expressed as∆P≡(B-D)+(I-E)
In other words, the population growth of a period can be calculated in two parts, natural growth of population (B-D) and mechanical growth of population (I-E),in which Mechanical growth of population is mainly affected by social factors, e.g. the advanced economies are growing faster while the backward economies are growing slowly even with negative growth.
Population growth rate
In demographics and ecology, population growth rate (PGR) is the rate at which the number of individuals in a population increases in a given time period as a fraction of the initial population. Specifically, PGR ordinarily refers to the change in population over a unit time period, often expressed as a percentage of the number of individuals in the population at the beginning of that period. This can be written as the formula:[2]

A positive growth ratio (or rate) indicates that the population is increasing, while a negative growth ratio indicates the population is decreasing. A growth ratio of zero indicates that there were the same number of people at the two times -- net difference between births, deaths a growth rate may be zero even when there are significant changes in the birth rates, death rates, immigration rates, and age distribution between the two times. [3] Equivalently, percent death rate = the average number of deaths in a year for every 100 people in the total population.
If the length of the time is taken smaller and smaller, the PGR approaches the logarithmic derivative of the population function P. If the population as a function of time is exponential, say P(t) = Ceat, the logarithmic derivative is a. Thus, the PGR approximates the exponent a for populations with exponential growth.
A related measure is the net reproduction rate. In the absence of migration, a net reproduction rate of more than one indicates that the population of women is increasing, while a net reproduction rate less than one (sub-replacement fertility) indicates that the population of women is decreasing.
Excessive growth and decline
Main articles: Overpopulation and Population decline
Population exceeding the carrying capacity of an area or environment is called overpopulation. It may be caused by growth in population or by reduction in capacity. Spikes in human population can cause problems such as pollution and traffic congestion,
these might be resolved or worsened by technological and economic
changes. Conversely, such areas may be considered "underpopulated" if
the population is not large enough to maintain an economic system (see population decline). Between these two extremes sits the notion of the optimum population.Human population growth rate


The actual annual growth in the number of humans fell from its peak of 88.0 million in 1989, to a low of 73.9 million in 2003, after which it rose again to 75.2 million in 2006. Since then, annual growth has declined. In 2009, the human population increased by 74.6 million, which is projected to fall steadily to about 41 million per annum in 2050, at which time the population will have increased to about 9.2 billion.[11] Each region of the globe has seen great reductions in growth rate in recent decades, though growth rates remain above 2% in some countries of the Middle East and Sub-Saharan Africa, and also in South Asia, Southeast Asia, and Latin America.[12]
Some countries experience negative population growth, especially in Eastern Europe mainly due to low fertility rates, high death rates and emigration, as well as abortion. In Southern Africa, growth is slowing due to the high number of HIV-related deaths. Some Western Europe countries might also encounter negative population growth.[13] Japan's population began decreasing in 2005.[14]
Growth by country
According to United Nations population statistics, the world population grew by 30%, or 1.6 billion people, between 1990 and 2010.[15] As persons the increase was among highest in India 350 million and China 196 million. Population growth was among highest in the United Arab Emirates (315%) and Qatar (271%).[15]| Rank | Country | Population 2010 |
Population 1990 |
Growth (%) 1990-2010 |
|---|---|---|---|---|
| World | 6,895,889,000 | 5,306,425,000 | 30.0% | |
| 1 | 1,341,335,000 | 1,145,195,000 | 17.1% | |
| 2 | 1,224,614,000 | 873,785,000 | 40.2% | |
| 3 | 310,384,000 | 253,339,000 | 22.5% | |
| 4 | 239,871,000 | 184,346,000 | 30.1% | |
| 5 | 194,946,000 | 149,650,000 | 30.3% | |
| 6 | 173,593,000 | 111,845,000 | 55.3% | |
| 7 | 158,423,000 | 97,552,000 | 62.4% | |
| 8 | 148,692,000 | 105,256,000 | 41.3% | |
| 9 | 142,958,000 | 148,244,000 | -3.6% | |
| 10 | 128,057,000 | 122,251,000 | 4.7% |
1960s to 2010 table of population growth
| Population growth 1990-2008 (%)[16] | |
|---|---|
| Africa | 55 % |
| Middle East | 51 % |
| Asia | 35 % |
| Latin America | 30 % |
| OECD North America | 24 % |
| OECD Europe | 9 % |
| OECD Pacific | 8 % |
| Former Soviet Union | -1 % |
| Non-OECD Europe | -11 % |
The situation was most acute in northern, western and central Africa. Refugees from places like the Sudan have helped further strain the resources of neighbouring states like Chad and Egypt. The nation is also host to roughly 255,000 refugees from Sudan’s Darfur region, and about 77,000 refugees from the Central African Republic, whilst approximately 188,000 Chadians have been displaced by their own civil war and famines, have either fled to either the Sudan, the Niger or, more recently, Libya.
| Example nation | 1st Population total. | 2nd Population total. | 3rd Population total. | 4th Population total. | 5th Population total. | Life expectancy in years. | Total population growth from 1st Pop. Total to 5th Pop. Total. |
|---|---|---|---|---|---|---|---|
| Eritrea* | N/A* | N/A* | 3,437,000(1994)[18] | 4,298,269 (2002) | 5,673,520 (2008)[19] | 61 (2008)[20] | 2,236,520 (since independence) |
| Ethiopia* | 23,457,000(1967)*[21] | 50,974,000(1990)* [22] | 54,939,000(1994) [18] | 67,673,031(2003) | 79,221,000(2008)[23] | 55(2008)[20] | 55,764,000 |
| Sudan** | 14,355,000(1967)**[21] | 25,204,000(1990)** [22] | 27,361,000 (1994)**[18] | 38,114,160 (2003)** | 42,272,000(2008)**[24] | 50(2008)**[20] | 27,917,000 |
| Chad | 3,410,000(1967)[21] | 5,679,000(1990) [22] | 6,183,000 (1994)[18] | 9,253,493(2003) | 10,329,208 (2009)[17] | 47(2008)[20] | 6,919,205 |
| Niger | 3,546,000(1967)[21] | 7,732,000(1990) [22] | 8,846,000(1994)[18] | 10,790,352 (2001) | 15,306,252 (2009)[25] | 44 (2008)[20] | 11,760,252 |
| Nigeria | 61,450,000(1967)[21] | 88,500,000(1990) [22] | 108,467,000 (1994)[18] | 129,934,911 (2002) | 158,259,000 (2008)[26] | 47(2008)[20] | 96,809,000 |
| Mali | 4,745,000(1967)[21] | 8,156,000(1990),[22] | 10,462,000(1994)[18] | 11,340,480(2002) | 14,517,176(2010).[27] | 50(2008)[20] | 9,772,176 |
| Mauritania | 1,050,000(1967)[21] | 2,025,000(1990) [22] | 2,211,000 (1994)[18] | 2,667,859 (2003) | 3,291,000 (2009)[17] | 54(2008)[20] | 2,241,000 |
| Senegal | 3,607,000(1967)[21] | 7,327,000(1990) [22] | 8,102,000 (1994) [18] | 9,967,215(2002) | 13,711,597 (2009)[28] | 57(2008)[20] | 10,104,597 |
| Gambia | 343,000(1967)[21] | 861,000(1990) [22] | 1,081,000 (1994)[18] | 1,367,124 (2000) | 1,705,000(2008)[26] | 55(2008)[20] | 1,362,000 |
| Algeria | 11,833,126 (1966)[21] | 25,012,000 (1990) [22] | 27,325,000 (1994) [18] | 32,818,500 (2003) | 34,895,000[23][29](2008) | 74 (2008)[20] | 23,061,874 |
| The DRC/Zaire | 16,353,000(1967)[21] | 35,562,000 (1990) [22] | 42,552,000 (1994) [18] | 55,225,478 (2003) | 70,916,439 (2008) [23][30] | 54(2008)[20] | 54,563,439 |
| Egypt | 30,083,419 (1966)[21] | 53,153,000 (1990) [22] | 58,326,000 (1994) [18] | 70,712,345 (2003) | 79,089,650 [31][31] (2008) [23] | 72 (2008)[20] | 49,006,231 |
| Réunion (French colony) | 418,000 (1967)[21] | N/A(1990) [22] | N/A (1994)[18] | 720,934 (2003) | 827,000 (2009) [29] | N/A (2008)[20] | 409,000 |
| The Falkland Islands (UK Territory) | 2,500(1967)[21] | N/A(1990) [22] | N/A(1994)[18] | 2,967 (2003) | 3,140(2010)[17] | N/A(2008)[20] | 640 |
| Chile | 8,935,500(1967)[21] | 13,173,000 (1990) [22] | 13,994,000(1994)[18] | 15,116,435 (2002) | 17,224,200 (2011) | 77 (2008)[20] | 8,288,700 |
| Colombia | 19,191,000(1967)[21] | 32,987,000(1990) [22] | 34,520,000(1994)[18] | 41,088,227 (2002) | 45,925,397(2010)[32] | 73 (2008)[20] | 26,734,397 |
| Brazil | 85,655,000(1967)[21] | 150,368,000 (1990) [22] | 153,725,000 (1994)[18] | 174,468,575 (2000) | 190,732,694(2010) [33] | 72(2008)[20] | 105,077,694 |
| Mexico | 45,671,000(1967)[21] | 86,154,000(1990) [22] | 93,008,000(1994)[18] | 103,400,165 (2000) | 112,322,757(2010)[34] | 76(2008)[20] | 66,651,757 |
| Fiji | 476,727 (1966)[21] | 765,000(1990) [22] | 771,000 (1994)[18] | 844,330 (2001) | 849,000[29] (2010) | 70 (2008)[20] | 372,273 |
| Nauru | 6,050(1966)[21] | 10,000(1990) [22] | N/A (1994)[18] | 12,329 (2002) | 9,322 (2011)[35] | N/A (2008)[20] | 3,272 |
| Jamaican | 1,876,000 (1967)[21] | 2,420,000 (1990) [22] | 2,429,000 (1994)[18] | 2,695,867 (2003) | 2,847,232[36](2010) | 74 (2008)[20] | 971,232 |
| Australia | 11,540,764 (1964)[21] | 17,086,000 (1990) [22] | 17,843,000 (1994)[18] | 19,546,792 (2003) | 23,009,879[37] (2010) | 82 (2008)[20] | 11,066,508 |
| Albania | 1,965,500(1964)[21] | 3,250,000 (1990) [22] | 3,414,000 (1994)[18] | 3,510,484 (2002) | 2,986,952 (July 2010 est.)[17][38] (2010) | 78 (2008)[20] | 1,021,452 |
| Poland | 31,944,000(1967)[21] | 38,180,000 (1990) [22] | 38,554,000 (1994)[18] | 38,626,349 (2001) | 38,192,000(2010)[39] | 75 (2008)[20] | 6,248,000 |
| Hungary | 10,212,000(1967)[21] | 10,553,000 (1990) [22] | 10,261,000 (1994)[18] | 10,106,017 (2002) | 9,979,000(2010)[40] | 73 (2008)[20] | -142,000 |
| Bulgaria | 8,226,564(1965)[21] | 8,980,000 (1990) [22] | 8,443,000 (1994)[18] | 7,707,495(2000) | 7,351,234 (2011)[41] | 73 (2008)[20] | -875,330 |
| UK | 55,068,000 (1966)[21] | 57,411,000 (1990) [22] | 58,091,000 (1994) [18] | 58,789,194 (2002) | 62,008,048 (2010)[42] | 79(2008)[20] | 7,020,048 |
| Ireland/Éire | 2,884,002(1966)[21] | 3,503,000(1990) [22] | 3,571,000 (1994)[18] | 3,840,838 (2000) | 4,470,700 [43] (2010) | 78 (2008)[20] | 1,586,698 |
| The PRC/China | 720,000,000(1967)[21] | 1,139,060,000(1990) [22] | 1,208,841,000 (1994)[18] | 1,286,975,468 (2004) | 1,339,724,852(2010)[44] | 73 (2008)[20] | 619,724,852 |
| Japan*** | 98,274,961(1965)[21] | 123,537,000(1990) [22] | 124,961,000 (1994)[18] | 127,333,002 (2002) | 127,420,000 (2010)[45] | 82(2008)[20] | 28,123,865 |
| Ryukyu Islands (Once occupied by America)*** | 934,176(1965)[21] | — | — | — | — | — | — |
| India# | 511,115,000 (1967)[21] | 843,931,000 (1990) [22] | 918,570,000 (1994)[18] | 1,028,610,328 (2001) | 1,210,193,422(2011)[46] | 69 (2008)[20] | 699,078,422 |


India's Population 2012
| Current Population of India in 2012 | 1,220,200,000 (1.22 billion) |
| Total Male Population in India | 628,800,000 (628.8 million) |
| Total Female Population in India | 591,400,000 (591.4 million) |
| Sex Ratio | 940 females per 1,000 males |
| Age structure | |
| 0 to 25 years | 50% of India's current population |
| Currently, there are about 51 births in India in a minute. | |
| India's Population in 2011 | 1.21 billion |
| India's Population in 2001 | 1.02 billion |
| Population of India in 1947 | 350 million |
Current Population of India - India, with
1,220,200,000 (1.22 billion) people is the second most populous country
in the world, while China is on the top with over 1,350,044,605 (1.35
billion) people. The figures show that India represents almost 17.31% of
the world's population, which means one out of six people on this planet
live in India. Although, the crown of the world's most populous country
is on China's head for decades, India is all set to take the numero uno
position by 2030. With the population growth rate at 1.58%, India is
predicted to have more than 1.53 billion people by the end of 2030.
More than 50% of India's current population is below the age of 25 and over 65% below the age of 35. About 72.2% of the population lives in some 638,000 villages and the rest 27.8% in about 5,480 towns and urban agglomerations. The birth rate (child births per 1,000 people per year) is 22.22 births/1,000 population (2009 est.) while death rate (deaths per 1000 individuals per year) is 6.4 deaths/1,000 population. Fertility rate is 2.72 children born/woman (NFHS-3, 2008) and Infant mortality rate is 30.15 deaths/1,000 live births (2009 estimated). India has the largest illiterate population in the world. The literacy rate of India as per 2001 Population Census is 65.38%, with male literacy rate at 75.96% and female at 54.28%. Kerala has the highest literacy rate at 90.86%, Mizoram (88.80%) is on the second position and Lakshadweep (86.66%) is on third.
 Every
year, India adds more people than any other nation in the world, and in
fact the individual population of some of its states is equal to the
total population of many countries. For example, Population of Uttar
Pradesh (state in India) almost equals to the population of Brazil. It,
as per 2001 Population Census of India, has 190 million people and the
growth rate is 16.16%. The population of the second most populous state
Maharashtra, which has a growth rate of 9.42%, is equal to that of
Mexico's population. Bihar, with 8.07%, is the third most populous state
in India and its population is more than Germany's. West Bengal with
7.79% growth rate, Andhra Pradesh (7.41%) and Tamil Nadu (6.07%) are at
fourth, fifth and sixth positions respectively. The sex ratio of India
stands at 933. Kerala with 1058 females per 1000 males is the state with
the highest female sex ratio. Pondicherry (1001) is second, while
Chhatisgarh (990) and Tamil Nadu (986) are at third and fourth places
respectively. Haryana with 861 has the lowest female sex ratio.
Every
year, India adds more people than any other nation in the world, and in
fact the individual population of some of its states is equal to the
total population of many countries. For example, Population of Uttar
Pradesh (state in India) almost equals to the population of Brazil. It,
as per 2001 Population Census of India, has 190 million people and the
growth rate is 16.16%. The population of the second most populous state
Maharashtra, which has a growth rate of 9.42%, is equal to that of
Mexico's population. Bihar, with 8.07%, is the third most populous state
in India and its population is more than Germany's. West Bengal with
7.79% growth rate, Andhra Pradesh (7.41%) and Tamil Nadu (6.07%) are at
fourth, fifth and sixth positions respectively. The sex ratio of India
stands at 933. Kerala with 1058 females per 1000 males is the state with
the highest female sex ratio. Pondicherry (1001) is second, while
Chhatisgarh (990) and Tamil Nadu (986) are at third and fourth places
respectively. Haryana with 861 has the lowest female sex ratio.
Some of the reasons for India's rapidly growing population are poverty, illiteracy, high fertility rate, rapid decline in death rates or mortality rates and immigration from Bangladesh and Nepal. Alarmed by its swelling population, India started taking measures to stem the growth rate quite early. In fact India by launching the National Family Planning programme in 1952 became the first country in the world to have a population policy. The family planning programme yielded some noticeable results, bringing down significantly the country's fertility rate. In 1965-2009, the contraceptive usage more than tripled and the fertility rate more than halved. The efforts did produce positive results, however, failed to achieve the ultimate goal and the population of India since getting independence from Britain in 1947 increased almost three times. Whereas India has missed almost all its targets to bring the rate of population growth under control, China's 'One Child Policy' in 1978, has brought tremendous results for the latter. The policy claims to have prevented between 250 and 300 million births from 1978 to 2000 and 400 million births from 1979 to 2010.
More than 50% of India's current population is below the age of 25 and over 65% below the age of 35. About 72.2% of the population lives in some 638,000 villages and the rest 27.8% in about 5,480 towns and urban agglomerations. The birth rate (child births per 1,000 people per year) is 22.22 births/1,000 population (2009 est.) while death rate (deaths per 1000 individuals per year) is 6.4 deaths/1,000 population. Fertility rate is 2.72 children born/woman (NFHS-3, 2008) and Infant mortality rate is 30.15 deaths/1,000 live births (2009 estimated). India has the largest illiterate population in the world. The literacy rate of India as per 2001 Population Census is 65.38%, with male literacy rate at 75.96% and female at 54.28%. Kerala has the highest literacy rate at 90.86%, Mizoram (88.80%) is on the second position and Lakshadweep (86.66%) is on third.
Every
year, India adds more people than any other nation in the world, and in
fact the individual population of some of its states is equal to the
total population of many countries. For example, Population of Uttar
Pradesh (state in India) almost equals to the population of Brazil. It,
as per 2001 Population Census of India, has 190 million people and the
growth rate is 16.16%. The population of the second most populous state
Maharashtra, which has a growth rate of 9.42%, is equal to that of
Mexico's population. Bihar, with 8.07%, is the third most populous state
in India and its population is more than Germany's. West Bengal with
7.79% growth rate, Andhra Pradesh (7.41%) and Tamil Nadu (6.07%) are at
fourth, fifth and sixth positions respectively. The sex ratio of India
stands at 933. Kerala with 1058 females per 1000 males is the state with
the highest female sex ratio. Pondicherry (1001) is second, while
Chhatisgarh (990) and Tamil Nadu (986) are at third and fourth places
respectively. Haryana with 861 has the lowest female sex ratio.Some of the reasons for India's rapidly growing population are poverty, illiteracy, high fertility rate, rapid decline in death rates or mortality rates and immigration from Bangladesh and Nepal. Alarmed by its swelling population, India started taking measures to stem the growth rate quite early. In fact India by launching the National Family Planning programme in 1952 became the first country in the world to have a population policy. The family planning programme yielded some noticeable results, bringing down significantly the country's fertility rate. In 1965-2009, the contraceptive usage more than tripled and the fertility rate more than halved. The efforts did produce positive results, however, failed to achieve the ultimate goal and the population of India since getting independence from Britain in 1947 increased almost three times. Whereas India has missed almost all its targets to bring the rate of population growth under control, China's 'One Child Policy' in 1978, has brought tremendous results for the latter. The policy claims to have prevented between 250 and 300 million births from 1978 to 2000 and 400 million births from 1979 to 2010.
Current Population of India 2012 |
||||
| Rank | State or union territory | Population (2011 Census) | Density (per km²) | Sex ratio |
| 01 | Uttar Pradesh | 199,581,477 | 828 | 908 |
| 02 | Maharashtra | 112,372,972 | 365 | 946 |
| 03 | Bihar | 103,804,637 | 1102 | 916 |
| 04 | West Bengal | 91,347,736 | 1029 | 947 |
| 05 | Andhra Pradesh | 84,665,533 | 308 | 992 |
| 06 | Madhya Pradesh | 72,597,565 | 236 | 930 |
| 07 | Tamil Nadu | 72,138,958 | 555 | 995 |
| 08 | Rajasthan | 68,621,012 | 201 | 926 |
| 09 | Karnataka | 61,130,704 | 319 | 968 |
| 10 | Gujarat | 60,383,628 | 308 | 918 |
| 11 | Odisha | 41,947,358 | 269 | 978 |
| 12 | Kerala | 33,387,677 | 859 | 1,084 |
| 13 | Jharkhand | 32,966,238 | 414 | 947 |
| 14 | Assam | 31,169,272 | 397 | 954 |
| 15 | Punjab | 27,704,236 | 550 | 893 |
| 16 | Haryana | 25,353,081 | 573 | 877 |
| 17 | Chhattisgarh | 25,540,196 | 189 | 991 |
| 18 | Jammu and Kashmir | 12,548,926 | 56 | 883 |
| 19 | Uttarakhand | 10,116,752 | 189 | 963 |
| 20 | Himachal Pradesh | 6,856,509 | 123 | 974 |
| 21 | Tripura | 3,671,032 | 350 | 961 |
| 22 | Meghalaya | 2,964,007 | 132 | 986 |
| 23 | Manipur | 2,721,756 | 122 | 987 |
| 24 | Nagaland | 1,980,602 | 119 | 931 |
| 25 | Goa | 1,457,723 | 394 | 968 |
| 26 | Arunachal Pradesh | 1,382,611 | 17 | 920 |
| 27 | Mizoram | 1,091,014 | 52 | 975 |
| 28 | Sikkim | 607,688 | 86 | 889 |
| UT1 | Delhi | 16,753,235 | 9,340 | 866 |
| UT2 | Puducherry | 1,244,464 | 2,598 | 1,038 |
| UT3 | Chandigarh | 1,054,686 | 9,252 | 818 |
| UT4 | Andaman and Nicobar Islands | 379,944 | 46 | 878 |
| UT5 | Dadra and Nagar Haveli | 342,853 | 698 | 775 |
| UT6 | Daman and Diu | 242,911 | 2,169 | 618 |
| UT7 | Lakshadweep | 64,429 | 2,013 | 946 |
| Total | India | 1,210,193,422 | 382 | 940 |
|
NEWS
March 24, 2003 |
MUMBAI:
Maharashtra added about 1.8 crore people, equivalent to the total
population of Australia, to its populace in the decade ended '01,
getting the dubious distinction of becoming the country's second-most
populous state. Migration from other Indian states rose 23%,
significantly contributing to the state's population growth, which, as
on March 1, '03, stood at 10.1 crore. The state economic survey, which
was recently tabled in the legislative assembly, says Maharashtra's...
NEWS
October 25, 2004 |
NEW
DELHI: New immigrants will drive the boom in Canada's real estate
market. The boom will centre around rental housing market.
Traditionally, while immigrants have gone the rental route in and around
urban centres, natural born citizens and older immigrants have moved
out of cities into countryside. However, in the present
situation growth in ownership market may not be as remarkable. The
reason being rising interest rates and home prices will...
NEWS
June 22, 2012 |
Patna:
Expressing concern at the high fertility rate at 3.7 per cent in
Bihar, Chief Minister Nitish Kumar today said that it was
essential to step up the literacy rate to bring down the fertility
rate at par with national ratio. A strategy has to be formulated
to check population growth rate in Bihar which is has the highest
density as nine per cent of the country's people live in the state in an
area at 2.1 per cent of India's entire...
NEWS
June 14, 2012
RIO
DE JANEIRO: Twenty years after the first Earth Summit , a renewed
bid to rally the world behind a common environmental blueprint opened on
Wednesday in Rio de Janeiro against a backdrop of discord and
economic gloom . Kicking off the so-called Rio+20 summit ,
Dilma Rousseff , president of host nation Brazil, called on "all
countries of the world to commit" to reaching an accord that addresses
the most pressing environmental and...
NEWS
July 19, 2012 |
NEW
DELHI: CRH Plc , the $13.7-billion Irish building materials group,
has entered the fray to buy Jaiprakash Associates' cement plants
in Gujarat and Andhra Pradesh, after the Indian company's
discussions with the AV Birla Group got stuck due to differences
over valuation and other issues. The deal, if it materialises,
is expected to fetch Rs 8,000-9,000 crore for Jaiprakash Associates
and will help the company...
NEWS
July 12, 2012 |
NEW
DELHI: Global food commodity prices are expected to remain high
over the next decade on account of rising consumption and declining
agricultural production, the latest OECD-FAO Agricultural Outlook has
said. "The Outlook anticipates that agricultural output growth
will slow to an average of 1.7 per cent annually over the next 10 years,
down from a trend rate of over 2 per cent per year in recent decades,"
it said. ...
NEWS
July 11, 2012 |
MUMBAI:
It may be hard to believe but Mumbai recorded its slowest
population growth in almost a century in the last decade. The population
of the island city shrunk by 5.75% from 2001 to 2011, recording the
sharpest drop in south Mumbai since 1901, according to a detailed
analysis of the latest Census data . Although the suburbs added
8.01% more people in the same 10-year-period, their growth was the
slowest since the 1920s. On the occasion of World Population
Day ...
NEWS
July 6, 2012 |
WASHINGTON:
The outlook for the US job market brightened a little Thursday after
the government said fewer Americans applied for unemployment benefits
last week and surveys of private companies showed hiring increased in
June. The economy is still far from healthy. U.S. service
companies grew more slowly last month. Retail sales figures were
disappointing. And central banks in Europe and China cut their interest
rates, an indication that they expect weaker growth ahead. But...
NEWS
June 25, 2012 |
NEW
DELHI: The Planning Commission on Monday approved Puducherry's Rs
3,000 crore annual Plan outlay for 2012-13. The union territory's
outlay for the year 2012-13 was finalised here at a meeting between
Planning Commission Deputy Chairman Montek Singh Ahluwalia and
Puducherry Chief Minister N Rangasamy. Commenting on the
performance of the union territory, Ahluwalia said it has been achieving
satisfactory progress and development strategy was on...
Population A population is all the organisms that both belong to the same group or species and live in the same geographical area. In ecology the population of a certain species in a certain area is estimated using the Lincoln Index. The area that is used to define a sexual population is such that inter-breeding is possible between any pair within the area and more probable than cross-breeding with individuals from other areas. Normally breeding is substantially more common within the area than across the border.[1] In sociology, population refers to a collection of human beings. Demography is a social science which entails the statistical study of human populations. This article refers mainly to human population.
Population geneticsIn population genetics a sexual population is a set of organisms in which any pair of members can breed together. This means that they can regularly exchange gametes to produce normally-fertile offspring, and such a breeding group is also known therefore as a gamodeme. This also implies that all members belong to the same species, such as humans.[2] .If the gamodeme is very large (theoretically, approaching infinity), and all gene alleles are uniformally distributed by the gametes within it, the gamodeme is said to be panmictic. Under this state, allele (gamete) frequencies can be converted to genotype (zygote) frequencies by expanding an appropriate quadratic equation, as shown by Sir Ronald Fisher in his establishment of quantitative genetics. [3] Unfortunately, this seldom occurs in nature : localisation of gamete exchange - through dispersal limitations, or preferential mating, or cataclysm, or other cause - may lead to small actual gamodemes which exchange gametes reasonably uniformally within themselves, but are virtually separated from their neighbouring gamodemes. However, there may be low frequencies of exchange with these neighbours. This may be viewed as the breaking up of a large sexual population(panmictic)into smaller overlapping sexual populations. This failure of panmixia leads to two important changes in overall population structure: (1).the component gamodemes vary (through gamete sampling) in their allele frequencies when compared with each other and with the theoretical panmictic original (this is known as dispersion, and its details can be estimated using expansion of an appropriate binomial equation); and (2). the level of homozygosity rises in the entire collection of gamodemes. The overall rise in homozygosity is quantified by the inbreeding coefficient (f or φ). Note that all homozygotes are increased in frequency - both the deleterious and the desirable! The mean phenotype of the gamodemes collection is lower than that of the panmictic "original" - which is known as inbreeding depression. It is most important to note, however, that some dispersion lines will be superior to the panmictic original, while some will be about the same, and some will be inferior. The probabilities of each can be estimated from those binomial equations. In plant and animal breeding, procedures have been developed which deliberately utilise the effects of dispersion (such as line breeding, pure-line breeding, back-crossing). It can be shown that dispersion-assisted selection leads to the greatest genetic advance (ΔG = change in the phenotypic mean), and is much more powerful than selection acting without attendant dispersion. This is so for both allogamous (random fertilization)[4] and autogamous (self-fertilization) gamodemes[5]World human population
Main article: World population
As of today's date, the world population is estimated by the United States Census Bureau to be 7.031 billion.[6] The US Census Bureau estimates the 7 billion number was surpassed on 12 March 2012. According to a separate estimate by the United Nations, Earth’s population exceeded 7 billion in October 2011, a milestone that offers unprecedented challenges and opportunities to all of humanity, according to UNFPA, the United Nations Population Fund.[7]According to papers published by the United States Census Bureau, the world population hit 6.5 billion (6,500,000,000) on 24 February 2006. The United Nations Population Fund designated 12 October 1999 as the approximate day on which world population reached 6 billion. This was about 12 years after world population reached 5 billion in 1987, and 6 years after world population reached 5.5 billion in 1993. The population of some[which?] countries, such as Nigeria, is not even known to the nearest million,[8] so there is a considerable margin of error in such estimates.[9] Researcher, Carl Haub, calculated that a total of over 100 billion people have probably been born in the last 2000 years.[10] Predicted growth and decline
Main article: Population growth
Population growth increased significantly as the Industrial Revolution gathered pace from 1700 onwards.[11] The last 50 years have seen a yet more rapid increase in the rate of population growth[11] due to medical advances and substantial increases in agricultural productivity, particularly beginning in the 1960s,[12] made by the Green Revolution.[13] In 2007 the United Nations Population Division projected that the world's population will likely surpass 10 billion in 2055.[14]In the future, world population has been expected to reach a peak of growth, there it will decline due to economic reasons, health concerns, land exhaustion and environmental hazards. According to one report, it is very likely that the world's population will stop growing before the end of the 21st century. Further, there is some likelihood that population will actually decline before 2100.[15] Population has already declined in the last decade or two in Eastern Europe, the Baltics and in the Commonwealth of Independent States.[16] The population pattern of less-developed regions of the world in recent years has been marked by gradually declining birth rates following an earlier sharp reduction in death rates.[17] This transition from high birth and death rates to low birth and death rates is often referred to as the demographic transition.[17] Control
Main article: Human population control
Human population control is the practice of artificially altering the rate of growth of a human population. Historically, human population control has been implemented by limiting the population's birth rate, usually by government mandate, and has been undertaken as a response to factors including high or increasing levels of poverty, environmental concerns, religious reasons, and overpopulation. While population control can involve measures that improve people's lives by giving them greater control of their reproduction, some programs have exposed them to exploitation.Worldwide, the population control movement was active throughout the 1960s and 1970s, driving many reproductive health and family planning programs. In the 1980s, tension grew between population control advocates and women's health activists who advanced women's reproductive rights as part of a human rights-based approach.[18] Growing opposition to the narrow population control focus led to a significant change in population control policies in the early 1990s.[19] |